This project appeared on the website of the German news magazine Der SPIEGEL and was built with the team of their graphics desk.
Living in the noise of sirens
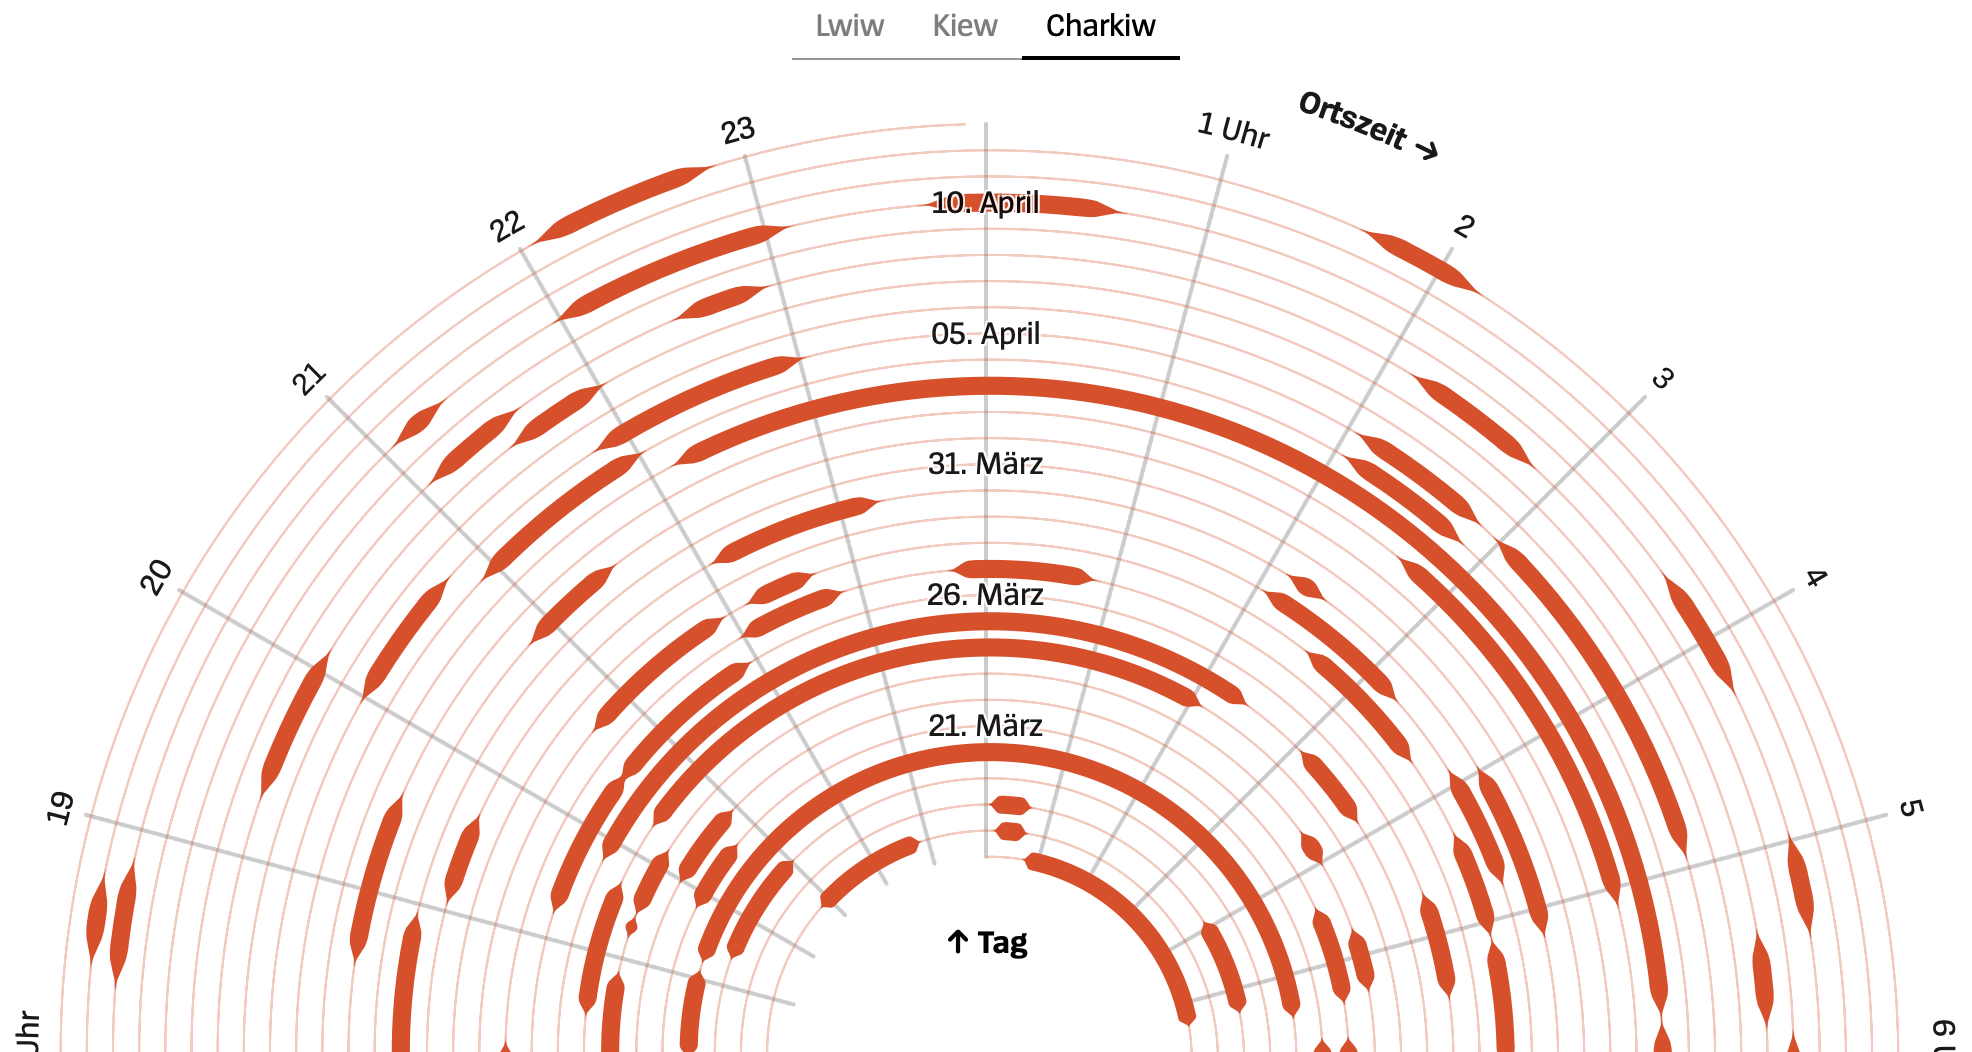
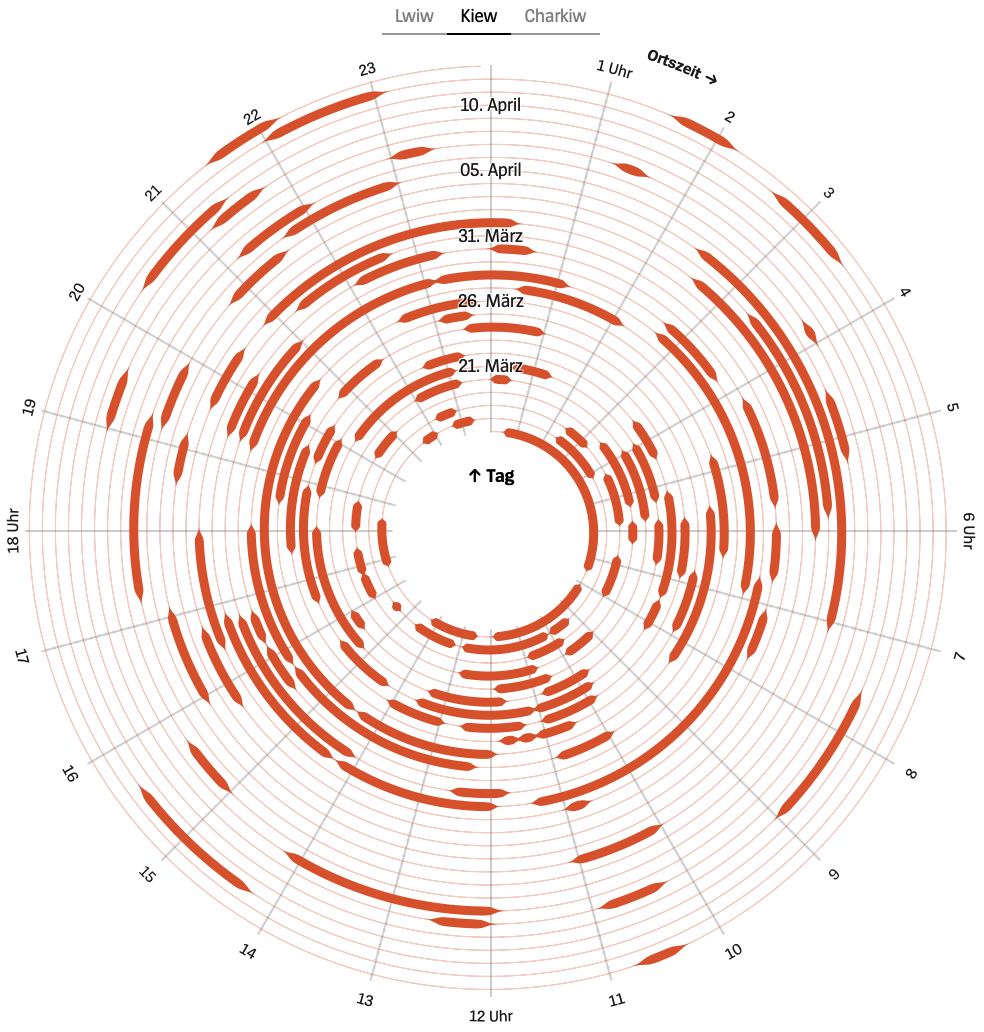
People in Ukraine live in constant fear of Russian air raids, and the sound of sirens is part of their everyday life. The evaluation of air alert data shows how often the population is exposed to this stress.
From data to chart
Volodymyr Agafonkin regularly scrapes automated Telegram channels to collect data about air alerts in different cities and regions of Ukraine. The data contains start and end times of the alarms and is suited to be presented as a spiral chart: 360 degrees make up one day. Additionally, the alarming look of the spiral and the coloring together with the underlying grid add an emotional layer to the visualization.
Custom SVG paths
In order to have full control of the actual shapes, we made use of highly customized SVG paths. A perfect interplay of our standard tools Svelte and D3 together with some math lead to convincing results.

The team
Matthias Stahl: Spriral data visualization design and coding
Alexander Epp: Story and additional charts
Explore the project