🖥 The code for this project has been published on GitHub.
📰 Axios published an article about the project.
A new field
In early summer I got contacted by the Atlantic Council‘s GeoEconomics Center. They were researching the worldwide development of digital currencies. I thought it’s all about card payments, but it isn’t. In fact, digital currencies are more like Bitcoin and other crypto currencies, but backed by a central bank and thus a government. They are called CBDCs – Central Bank Digital Currencies. A completely new field to me.
Visualizing the virtual
Dozens of countries are evaluating or already using digital currencies. I didn’t know about that. But I immediately realized that this is an important topic for so many people around the world. And the GeoEconomics center with its research team around director Josh Lipsky has been collecting a vast amount of information about the status of CBDC development in more than 80 countries.
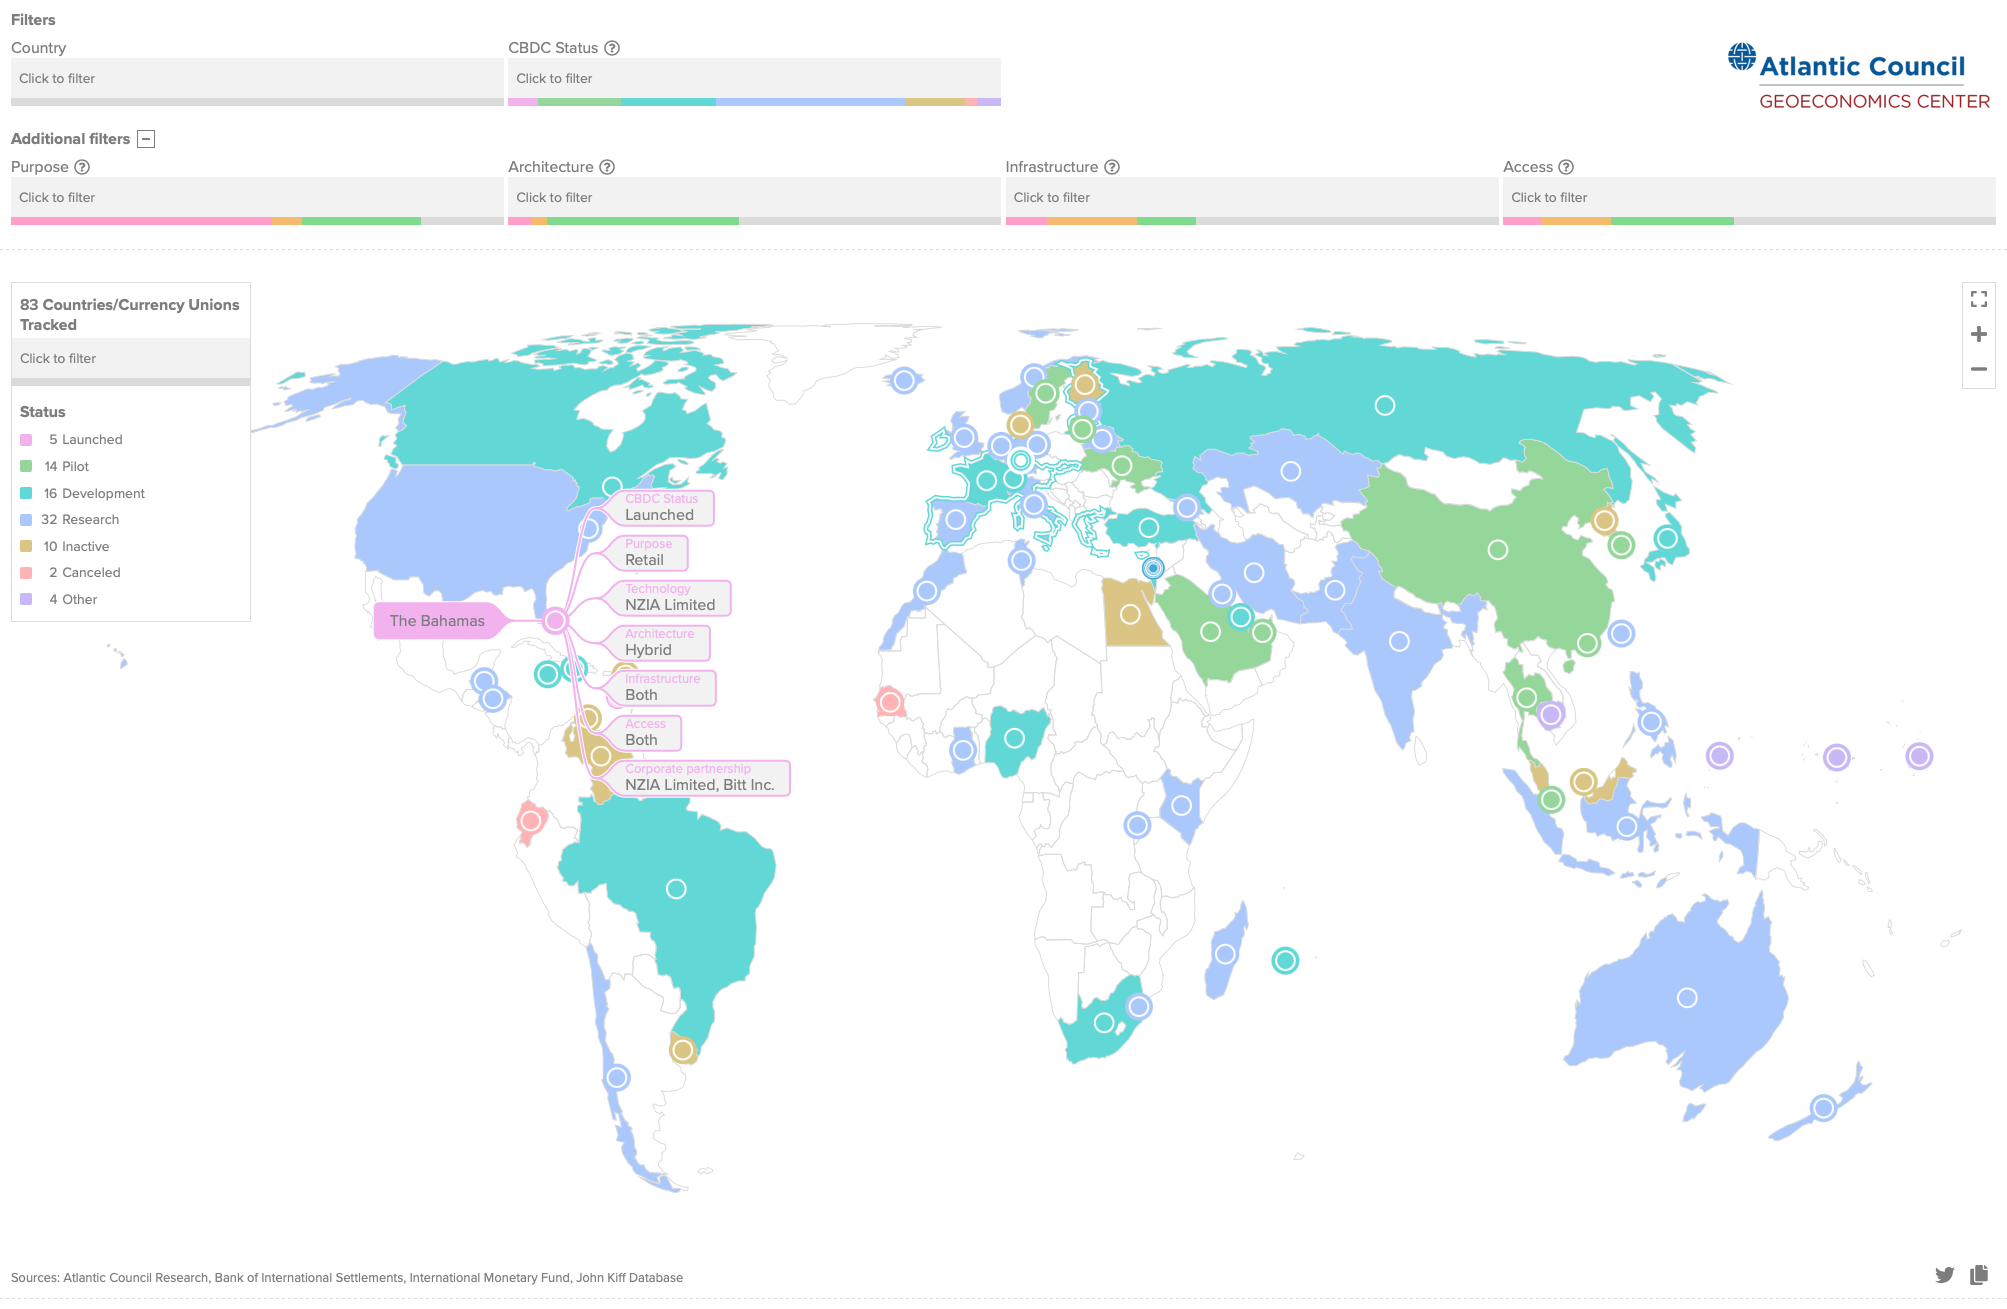
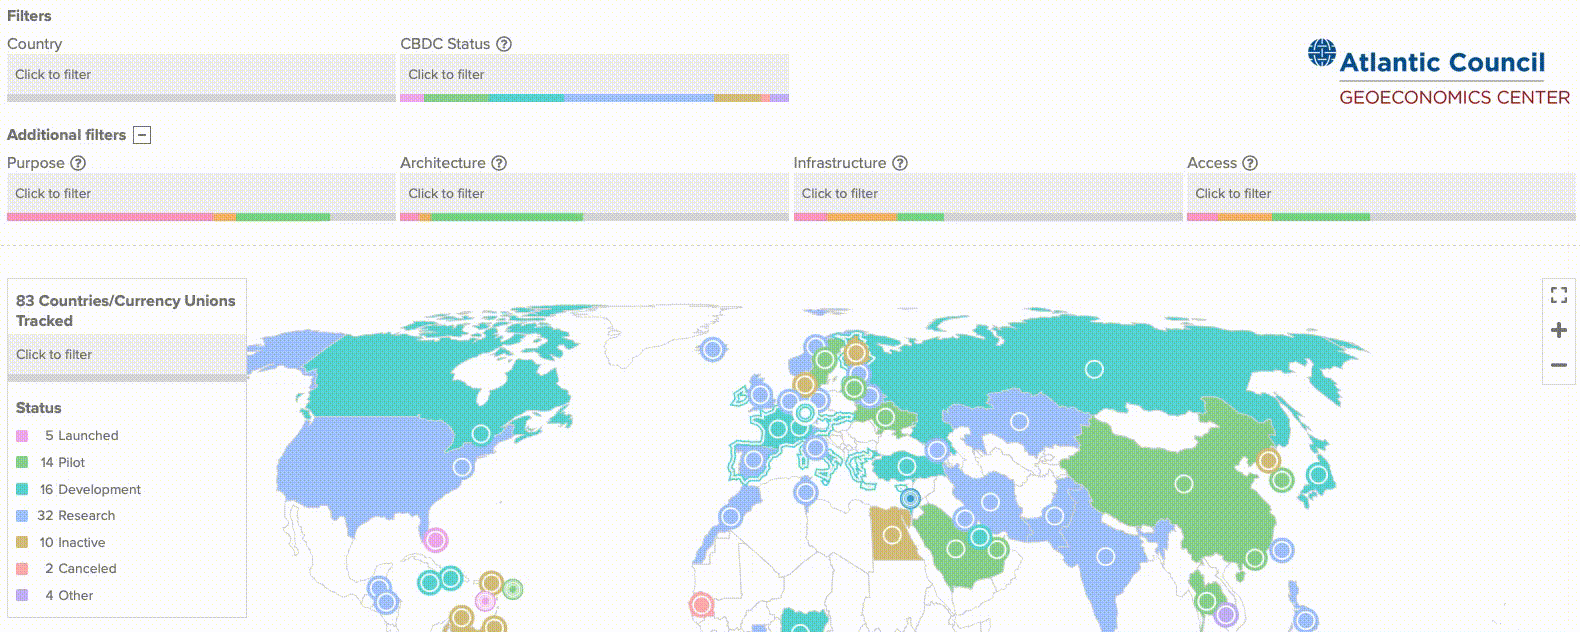
Thinking of the visualization I was supposed to create, it was clear that a complete overview is needed. Initially, the whole world has to be visible with the countries developing CBDCs highlighted. But – similar to my Iranian censorship project – it is equally important to be able to look into the specifics of each country. Which technology are they using, which architecture, which partnerships have they established?
Pimping a world map
I started off by creating a fully customized world map based on public coordinates and using an equal earth projection. The latter was important as I planned to turn the map into a choropleth one. Equal projections try to keep the relative country areas and do not artificially enlarge countries that are close to the poles.
I then developed a color palette for the most important variable in the data set: the CBDC status which represents the progress a country has made. Therefore, I always use the HCL Wizard and during my work on the CBDC Tracker, Theresa-Marie Rhyne published a detailed Nightingale article about the tool.
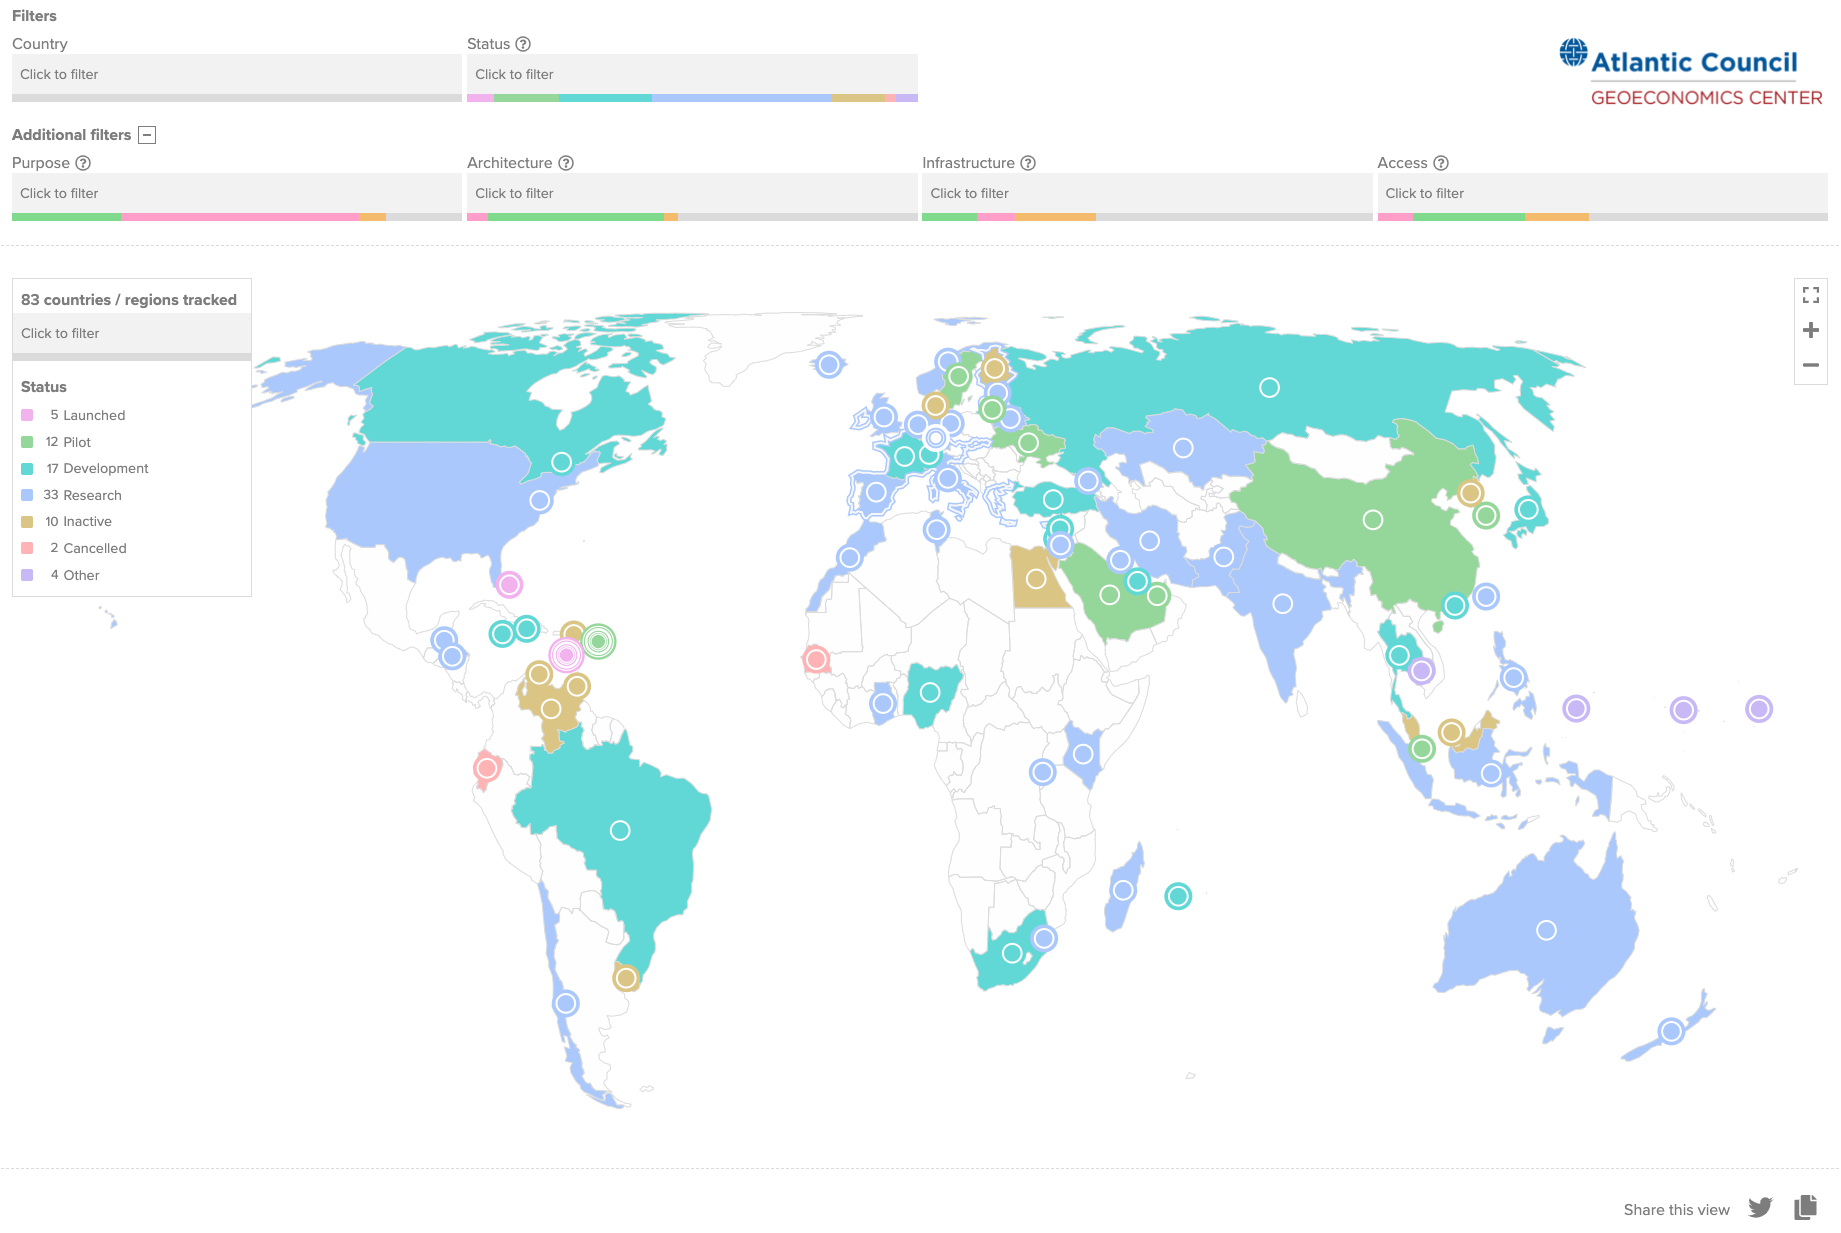
Next, I let D3 calculate the country centroids and used them to put little anchor points on top of the CBDC exploring countries. This was an important design step as I wanted to enable the audience to easily know more about a country of interest. So when users hover over one of these anchor points they get what I call hover tags (and my client funnily called spider legs :)).
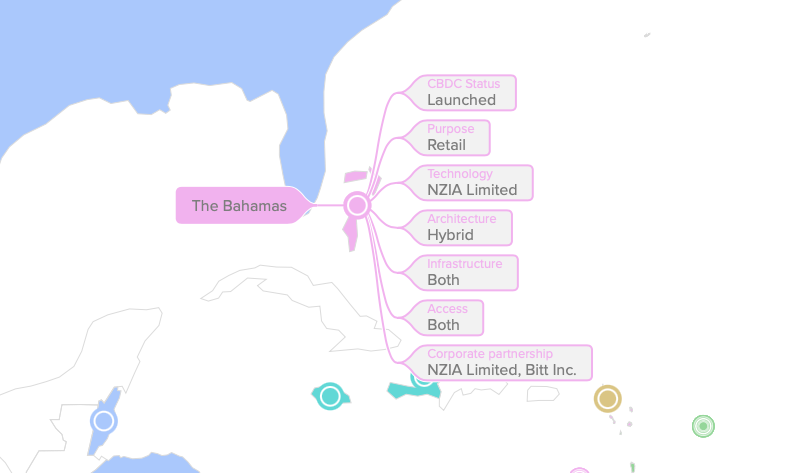
Finally, a click on the anchor point opens up a modal with all of the available information about a country. This does include the categorical variables that have already been shown on the hover tags plus some detailed descriptions.
The filters and technical details
One major requirement by the client was to have the ability to crossfilter the whole data set. It should be easy to explore which countries are in the pilot phase and which technologies they are using. No matter how users will filter the data set, I thought it would be awesome to always show an aggregation of all variables. To this end I designed dropdowns with a little stacked bar chart at the bottom. Jason Forrest called them Interactive Sparklines and I really like that. They are in fact interctive and change their proportions all the time when filters are applied. And, by the way, the expanded dropdown serves as the bar chart legend.
Once again, I selected Svelte as frontend framework in combination with D3, SVG and the HTML Canvas technology.
With Svelte it was an easy task to add elegant animations to the hover tags. I also embrace Svelte’s store concept which I use to manage the data, but also to abstract away all of the map logistics. Have a look at the code base, it’s all open source. It just makes so much fun to combine all the clever functions of the D3 library with Svelte magic. (Though it isn’t magic, it’s just a very well defined concept.)