🏆 This piece of art was selected for the 2021 Museum of Wild and Newfangled Art Biennial
🖥 The code for this project has been published on GitHub.
A COVID-19 visualization?
There have been lots and lots of data visualizations about the coronavirus crisis. I did not want to add another one, but I did want to create a piece of data art about a COVID-19 topic.
The mutants
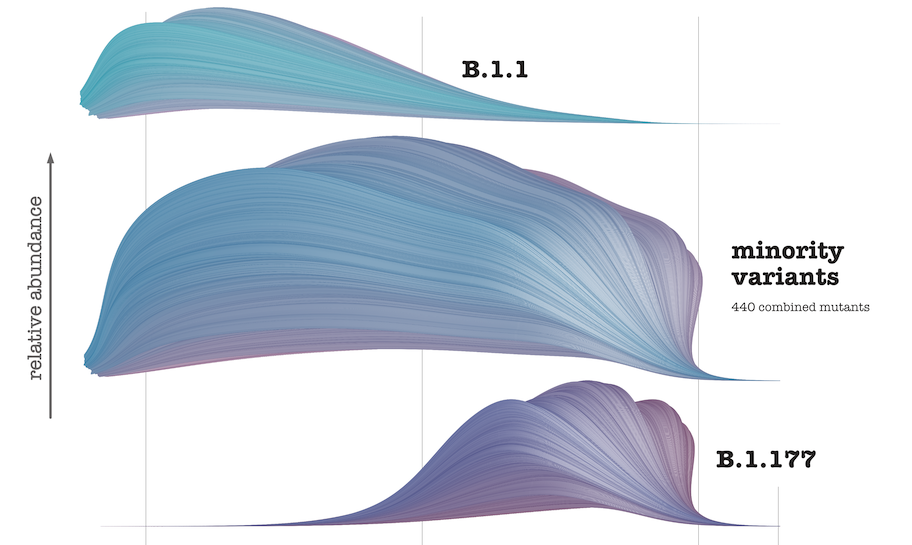
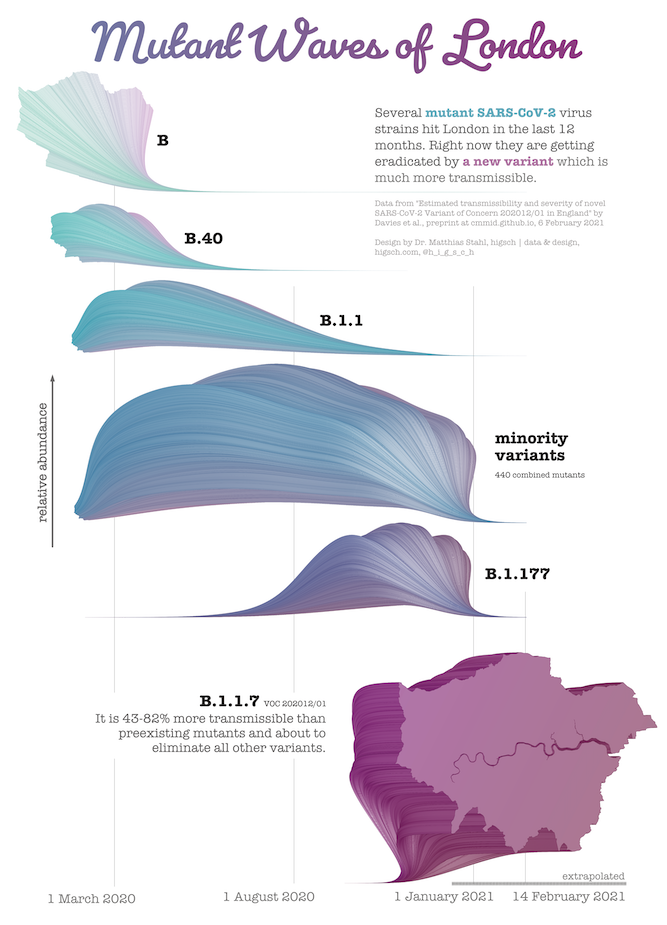
Recently, media coverage about the virus shifted to descriptions of the new virus mutants that have arisen all over the world. However, the media reports did not give me a feeling for how dynamic the variant evolution really is. Only when I discovered a scientific preprint about SARS-CoV-2 mutants in the United Kingdom did I become intrigued by the rapid mutant spreading waves rolling over London.
The art system
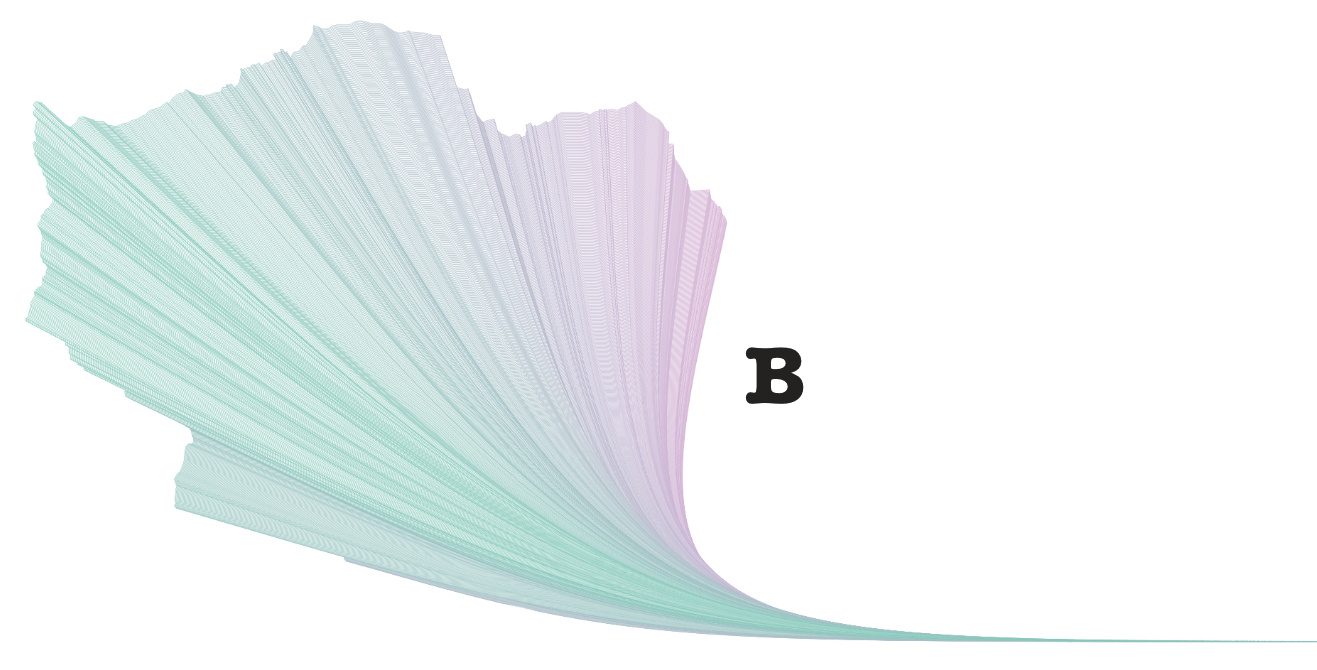
I am a big fan of Dan Gries’ approach to generate natural flows by plotting a semi-random shape on a canvas over and over again. I had his idea in the back of my head for quite some time and now I thought it might be optimal for generating waves. So I decided to take the geographic shape of the Greater London region and try to plot it for each mutant more than a thousand times along the x-axis of an HTML canvas. The x-axis is in fact the timeline.

Additionally, I shifted the shapes along the y-axis and resized the shape depending on the relative abundance of the respective virus mutant. So each plot is offset by a tiny little bit and in total creates the illusion of vivid waves.

Finally, I published the poster via Twitter and was overwhelmed by the community’s reactions. The piece even got me in contact with some of my major idols in data visualisation. Nevertheless, it remains a sad topic. The waves are fascinating at first sight, until you realise that these waves are killing waves.
