A talk about D3
In late August I was invited to give a talk at the seminar series “Coffee ‘n’ Code”, which was organized by Sara Sjunnebo and some others at the SciLifeLab National Genomics Infrastruture in Sweden. I was excited because the folks there have previously had an awesome lineup of speakers for their monthly bioinformatics-related seminars.
I decided to bring some art and color to SciLifeLab and started preparing a talk about how to use D3 to create custom visualizations. When I set out to build the first slides, I quickly felt that D3’s concepts are not suitable to be packed into a slide show. So I paused for a few days before I decided to go for a live-coding presentation.
Metadata
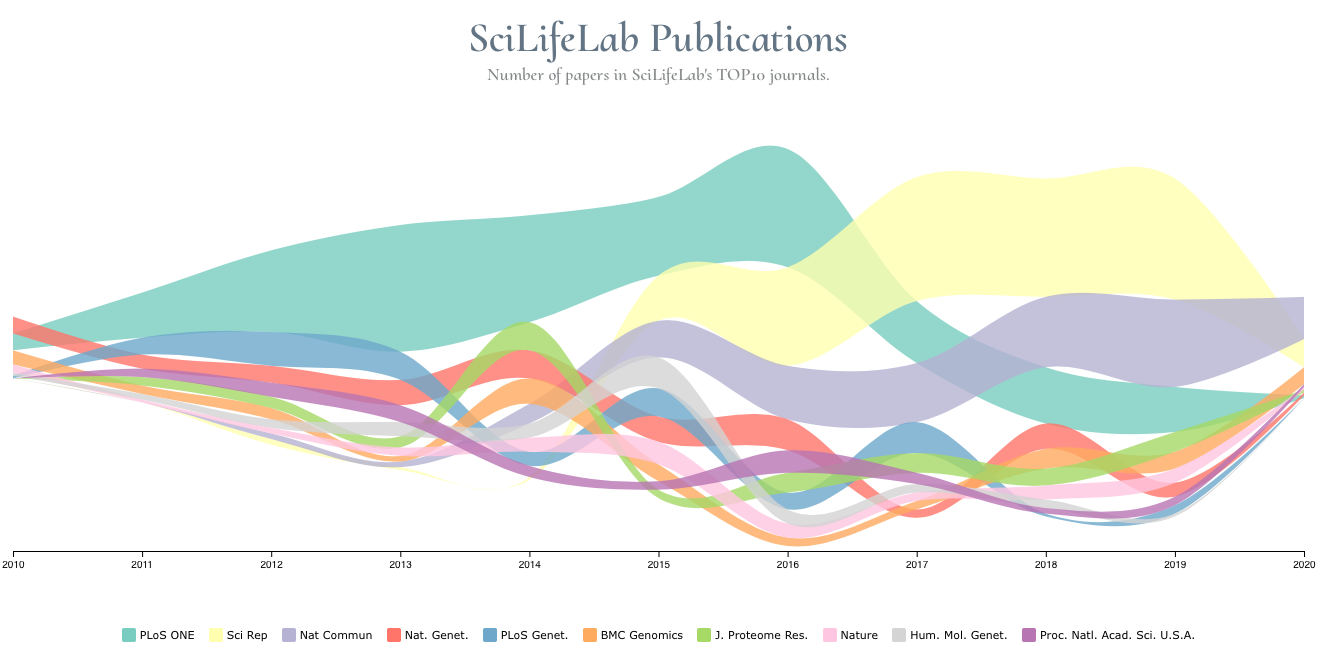
Although the talk was meant to be given in front of researchers (or at least in front of my webcam…), I tried to select a dataset which is not too abstract for a broad public audience. A few months before, I learned of SciLifeLab’s data center and that they provide all kinds of metadata about this prestigious Swedish research institution. They also have a record of all publications by their researchers over the last ten years. That was my dataset.
Journals are represented as areas stacked on top of each other.
Going live
At the end of August I live coded the whole thing. What should I say, it was a lot of fun. Thanks for the opportunity and the positive feedback! Now let’s go and learn some D3! :)